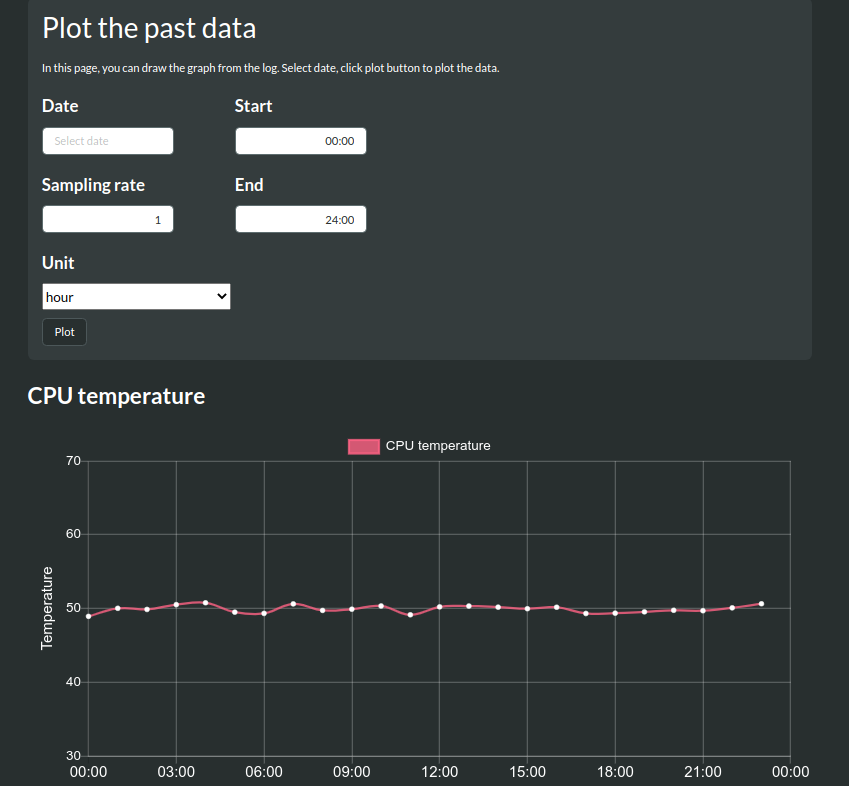
Plot the past data
While rstatmon is running, the obtained data will be written to log file. Thus, the data from past dates can be plotted on a graph. you can plot the past data in past data page which is in the nav-panel located on the left of page.
Plotting
Before plotting, you need to select the date and sampling rate for plotting. The number of the raw data tends to larger (for example the number of data could be about 86400 points per a day), so the data will be sampled to some extent when plotting for reducing load. How the data will be sample is determined by sampleing rate and unit fields. For example, when the rate and unit are set to 1 and hour respectively, The data will be sampled in an hour cycle, the number of the data will be 24 points (the time of each data will be 00:00, 01:00, 02:00, … 24:00).
To set sampling rate, select value in sampleing rate and unit fields. When you want to sample the data in a 2-hour cycle, Put 2 and select hour in the sampling rate and unit fields respectively, or in a 30-minute cycle, put 30 and select minute.
If you want to see the data in the specific range, set the time of start and end to start and end field respectively.
Set the value in all fields, then clicking plot button to show the data as in home page. The settings about x, y-axis, step size are shared with those in home page and can be changed from Settings page (See Graph setting).

The graphs will be shown in the same page to click plot button.
The description of each field is as follows.
- Date
The date to plot the data. Only the dates for which the log exist will be selectable, otherwise not.

The date can be selected from calendar.
- Sampling rate
The frequency to sample the data.
- Unit
The time unit of sampling. you can select either hour, minute or second.
- Start
The start time of the point where the data begins to plot. The format should be in HH:MM.
- End
The end time of the point where the data finished to plot. The format should be in HH:MM.